I recently started the Zero2Automated Advanced Malware Analysis Course created by @0verfl0w_ and @VK_Intel. So far I’ve found this to be an excellent course and I’m looking forward to completing the rest of it. I would highly recommend it to anyone looking to advance their skills in malware analysis or software reverse engineering! This post details one of the manual malware unpacking activities covered early-on in the course. I learned a bunch of new tricks from this section, so I thought I’d detail some of them here and hopefully showcase one of the many valuable lessons to be learned from this course.
What is Remcos?
From MITRE ATT&CK: “Remcos is a closed-source tool that is marketed as a remote control and surveillance software by a company called Breaking Security. Remcos has been observed being used in malware campaigns”. This Cisco Talos report does an excellent job of breaking down the malware - and below I’ll show you one example of how to unpack the sample manually with x32dbg. It’s worth noting here that although the Remcos malware is written in C++ this particular sample is packed with a .NET unpacker, meaning that unpacking the malware could also be performed using a .NET debugger like dnSpy
Useful Breakpoints For Manual Unpacking
Below are some functions that will prove very useful as breakpoints when manually unpacking malware in a debugger. This isn’t an exhaustive list and as you understand a sample’s functionality better, you can add / remove breakpoints as necessary depending on your intentions.
- VirtualAlloc
- Reserves, commits, or changes the state of a region of pages in the virtual address space of the calling process. Memory allocated by this function is automatically initialized to zero.
- Required for allocating regions of memory that packed/encrypted sections of payloads will be written into after being unpacked/decrypted
- VirtualProtect
- Changes the protection on a region of committed pages in the virtual address space of the calling process
- Useful in conjunction with
VirtualAllocwhen malware is attempting to change permissions of recently allocated memory. Breaking here after a call toVirtualAlloclikely means seeing what data was just written to the newly-allocated memory region.
- CreateProcessInternalW
- This is the undocumented function called under the hood by WinExec, ShellExecute, ShellExecuteEx and CreateProcess* - so breaking on it ensures that we catch any of the previously listed functions trying to spawn a new process! Breaking on this function means catching attempts to execute deobfuscated/unpacked/decrypted code from a packed sample
- IsDebuggerPresent
- Determines whether the calling process is being debugged by a user-mode debugger.
- May/may-not be useful depending on how many calls - but can be good to bypass very simple anti-analysis checks
- WriteProcessMemory
- Writes data to an area of memory in a specified process. The entire area to be written to must be accessible or the operation fails.
- Required for numerous process injection techniques to be able to write data into a remote process for execution
- NtResumeThread
- Undocumented function that will resume execution of a previously suspended thread
- Useful for breaking immediately before execution of a suspended thread
Unpacking Remcos in x32dbg
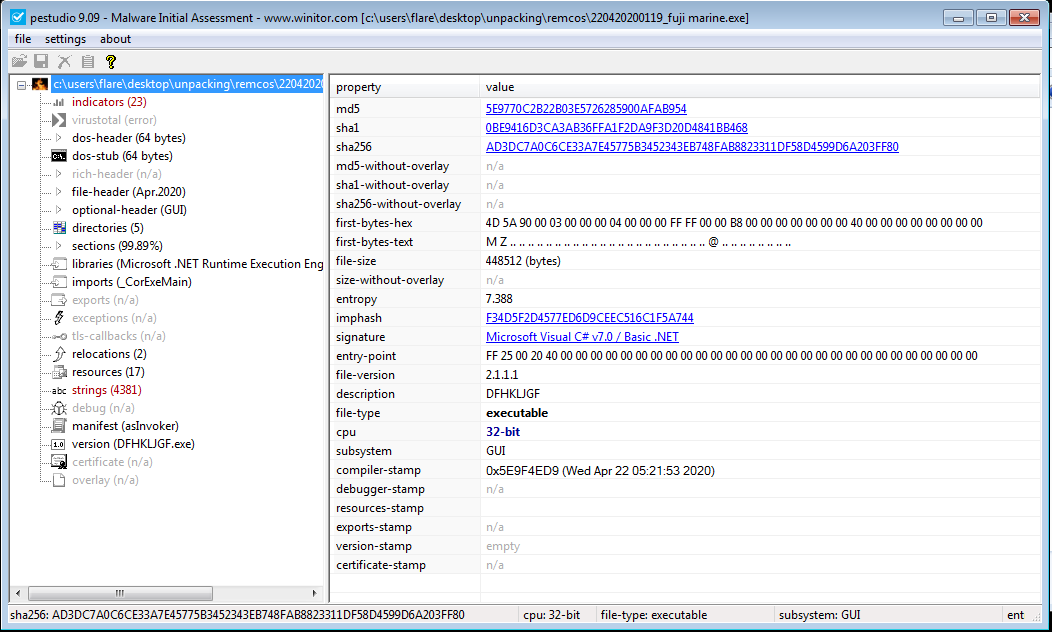
The following Remcos sample has the Adobe PDF icon but .exe file extension. PEstudio shows that it is in fact a .NET executable, meaning there will be some subtle differences in the way the sample must be unpacked.
We also see the high overall entropy suggesting that this sample is packed with a .NET packer. The sample also contains mostly garbage looking strings and imports aren’t resolved correctly by PEStudio because it’s a .NET assembly
IMPORTANT NOTE UPFRONT FOR UNPACKING .NET SAMPLES
When trying to view unpacked data being written into process memory by setting breakpoints on VirtualAlloc and VirtualProtect, remember that .NET will first call VirtualAlloc in order to check whether memory allocation is possible and only when successful, will it then attempt to actually allocate a buffer with a SECOND call to VirtualAlloc
Unpacking with x32dbg
- Firstly, the sample can be opened in x32dbg and standard breakpoints can be set as follows
VirtualAllocVirtualProtectCreateProcessInternalWIsDebuggerPresent
- After allowing the program to execute with the above breakpoints set, the
VirtualProtectwill be called numerous times initially, and eventually x32dbg will break on a sequence of calls toVirtualAlloc. The first of these (as mentioned above) will check if .NET is actually able to allocate a region of memory, then allocation will occur with a subsequent call toVirtualAlloc. The image below shows the memory address ineaxfor the first allocated section of memory, with the memory selected in Dump 1.
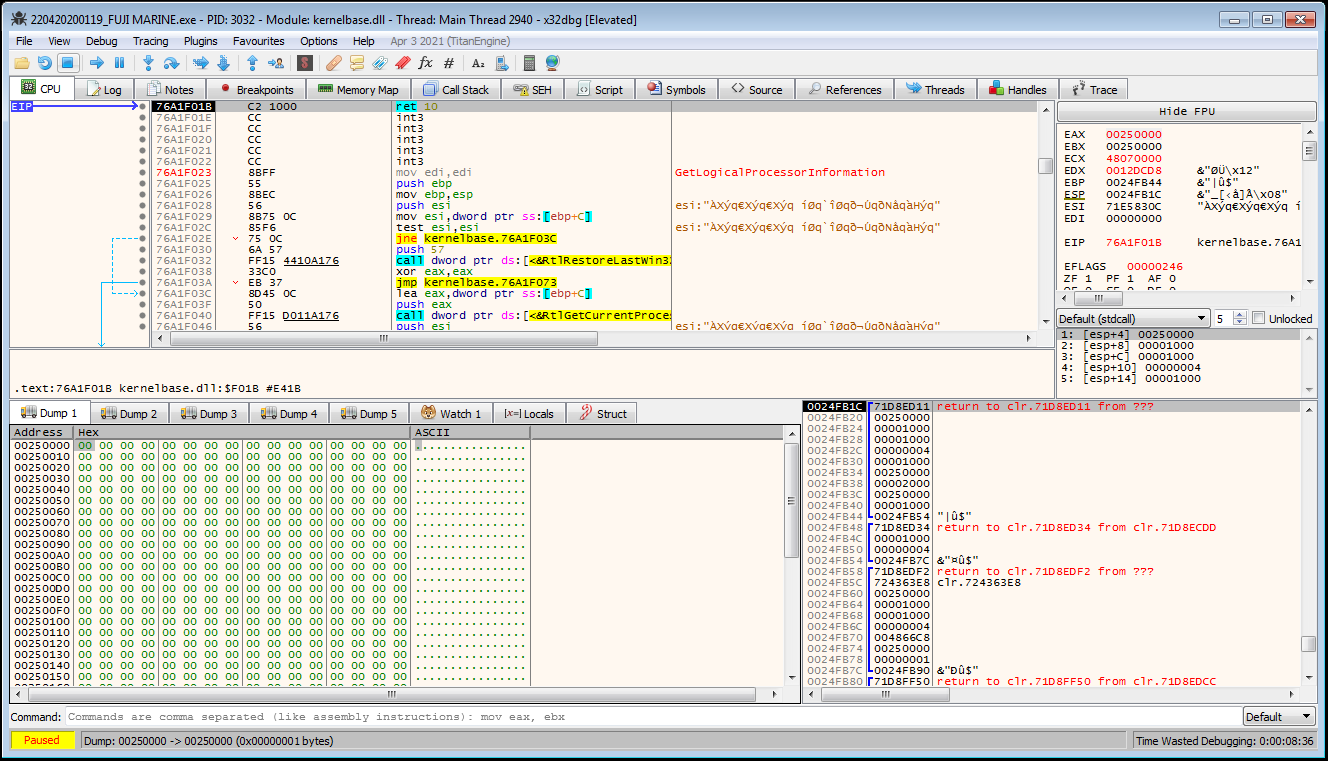
- Another series of calls to
VirtualAllocwill then subsequently be hit - and the first allocated region will be filled with0xFFbytes apart from a 256-byte section that ranges from0x01to0xFF
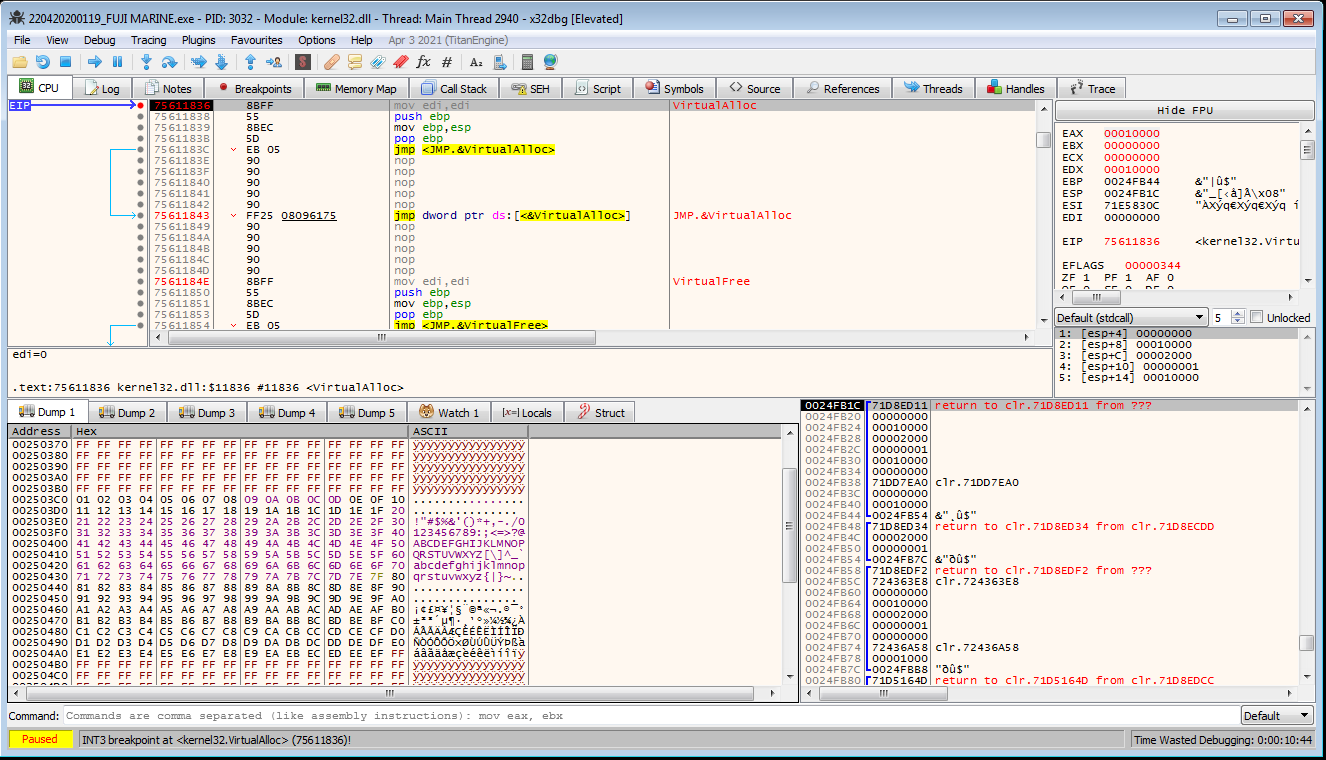
- This series of calls to
VirtualAlloccontinue with no interesting data written to any newly allocated memory regions. Eventually the program breaks on ajmptoIsDebuggerPresent.
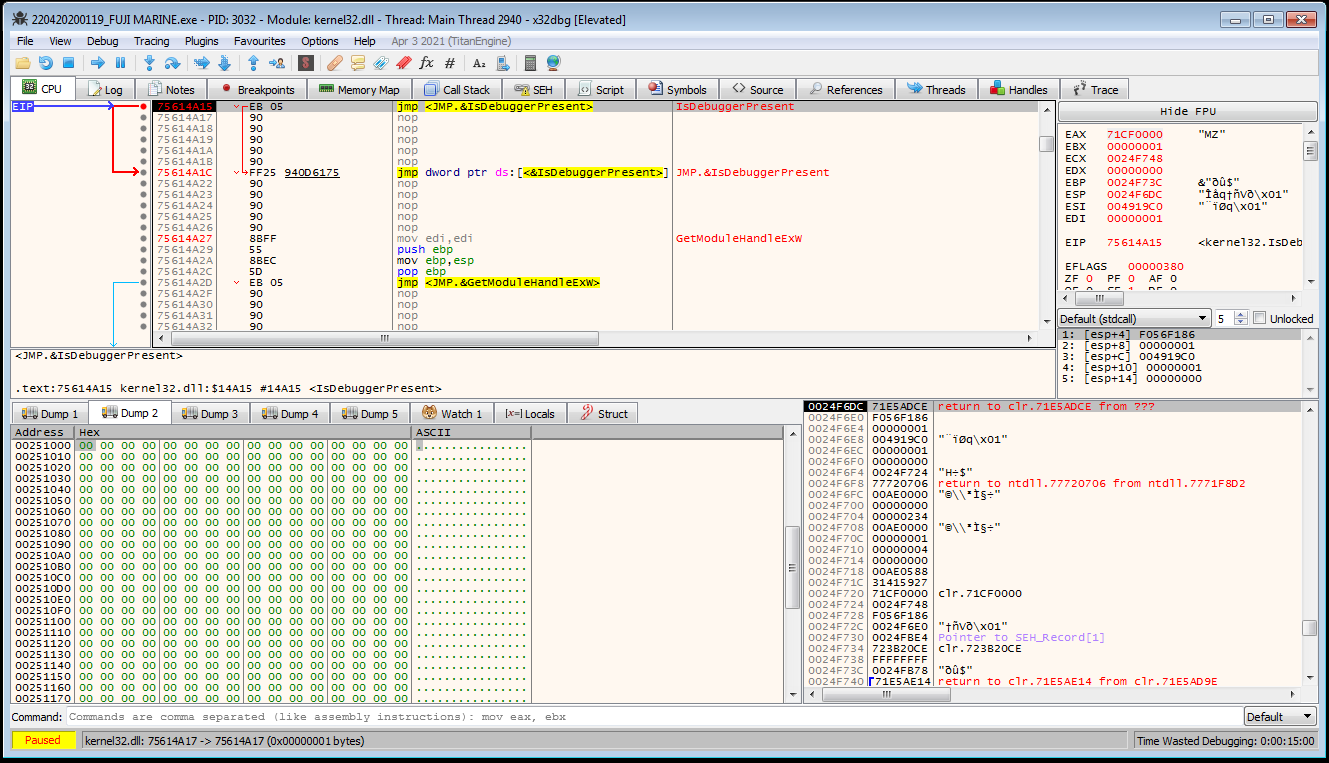
- This can be bypassed by selecting
Execute til return, and then decrementingeaxso that its value is0before continuing execution
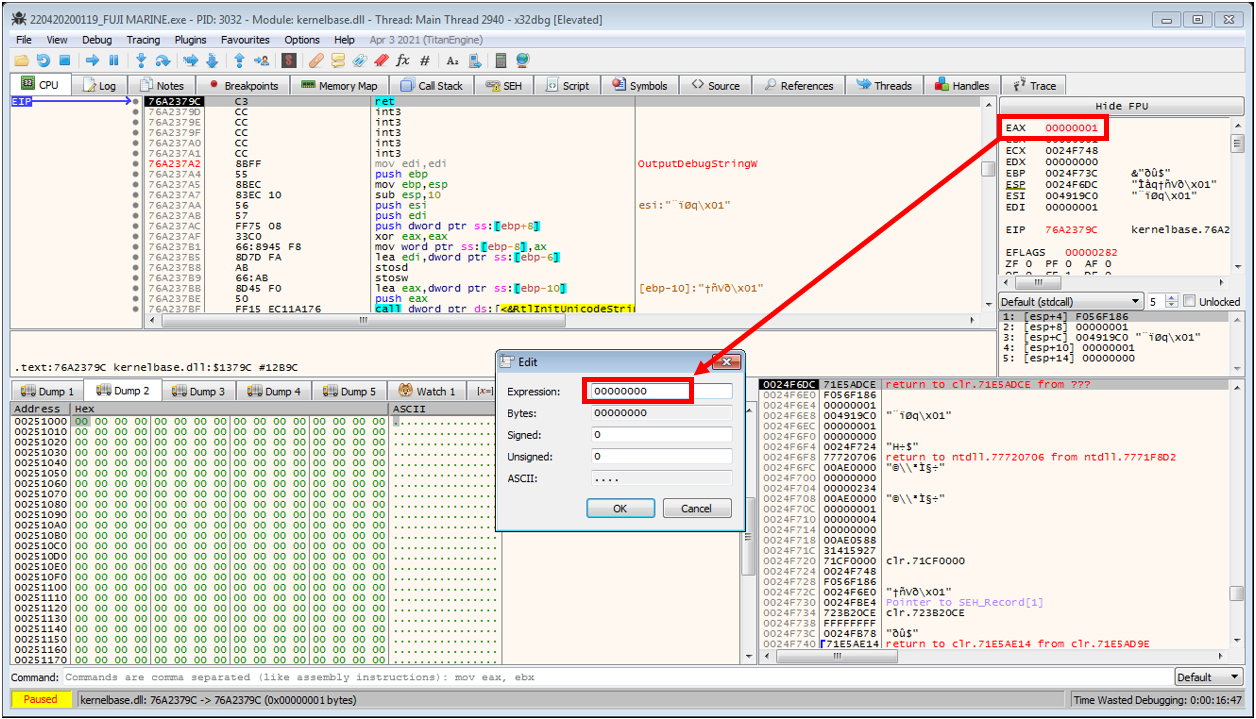
-
A subsequent call to
IsDebuggerPresentcan be bypassed using the same technique before another memory region is allocated viaVirtualAlloc. As before, the allocated region can be selected in a new dump, however nothing interesting has been written as yet. At this point the breakpoint toVirtualAlloccan be removed, and after continuing execution, a the next breakpoint hit is a call toVirtualProtect. The debugger will continue to break on a series of calls toVirtualProtectandIsDebuggerPresentwithout writing anything interesting to the dump. I also chose to remove the breakpoint atVirtualProtecthere as it is relatively useless without also breaking onVirtualAlloc. -
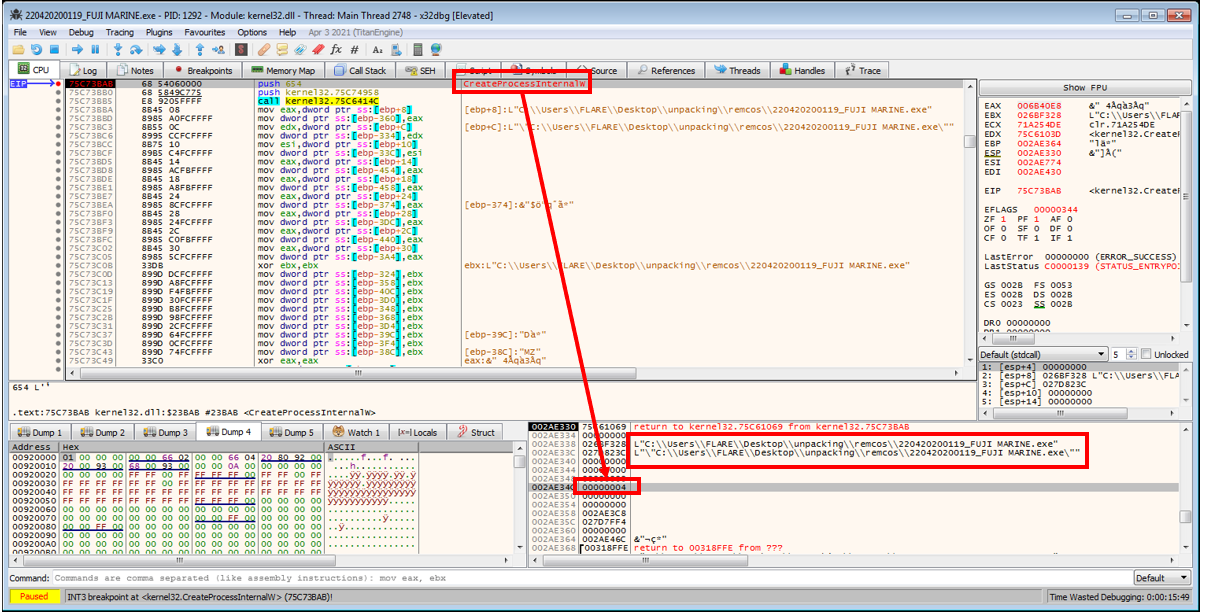
After allowing the sample to execute further, a breakpoint will then finally be hit at a call to
CreateProcessInternalW. This nice little function definition here shows that the function’s parameters are basically the same as the documentedCreateProcessfunctions. This shows that the values on the stack which serve as function parameters currently includedwCreationFlags=0x00000004, which can be looked up asCREATE_SUSPENDED. It also looks like thelpApplicationNameandlpCommandLineare being passed the name of the sample.
-
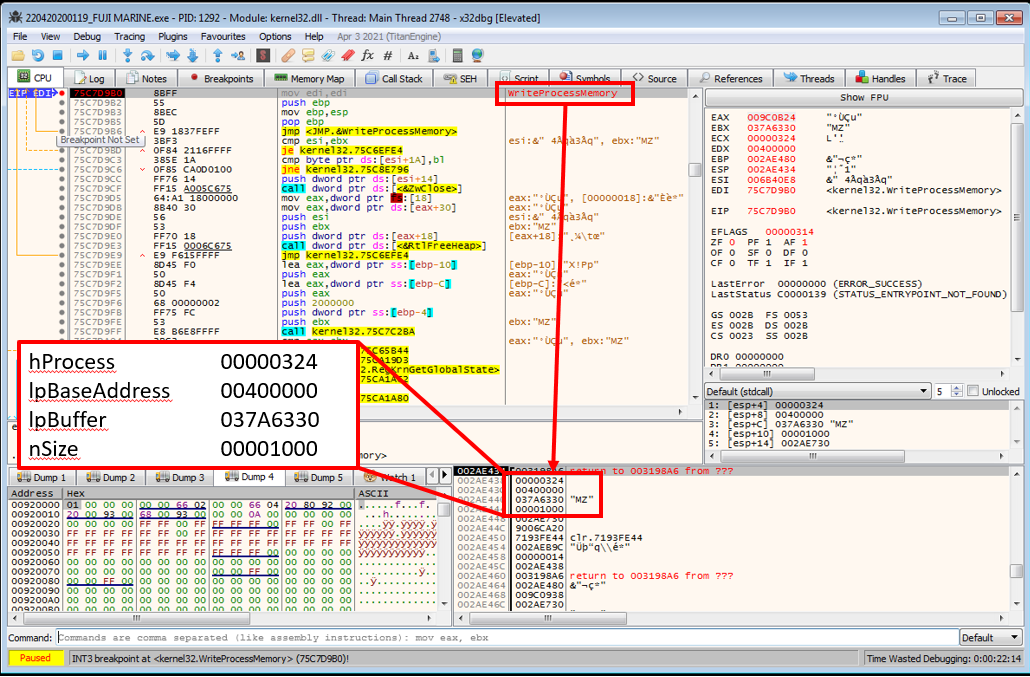
Given that a process is about to be created in a suspended state, it will need to be resumed via
NtResumeThreadwhich would make for an ideal breakpoint as process hollowing is likely about to occur - so I should be able to see whatever has been written into the process’ memory exactly before it is about to be executed. To verify the suspicion that process hollowing is about to occur, a breakpoint can also be set now onWriteProcessMemoryto catch exactly what data would be overwriting the currently mapped executable. - After resuming execution, the program will immediately break on a call to
WriteProcessMemoryas suspected! The following is the function definition from the Microsoft docs:BOOL WriteProcessMemory( HANDLE hProcess, LPVOID lpBaseAddress, LPCVOID lpBuffer, SIZE_T nSize, SIZE_T *lpNumberOfBytesWritten );By looking at the stack for function arguments I can see: - the handle to the process being written to - the base address that data will be written to - a pointer to the buffer containing the data to be written (most important in this case)
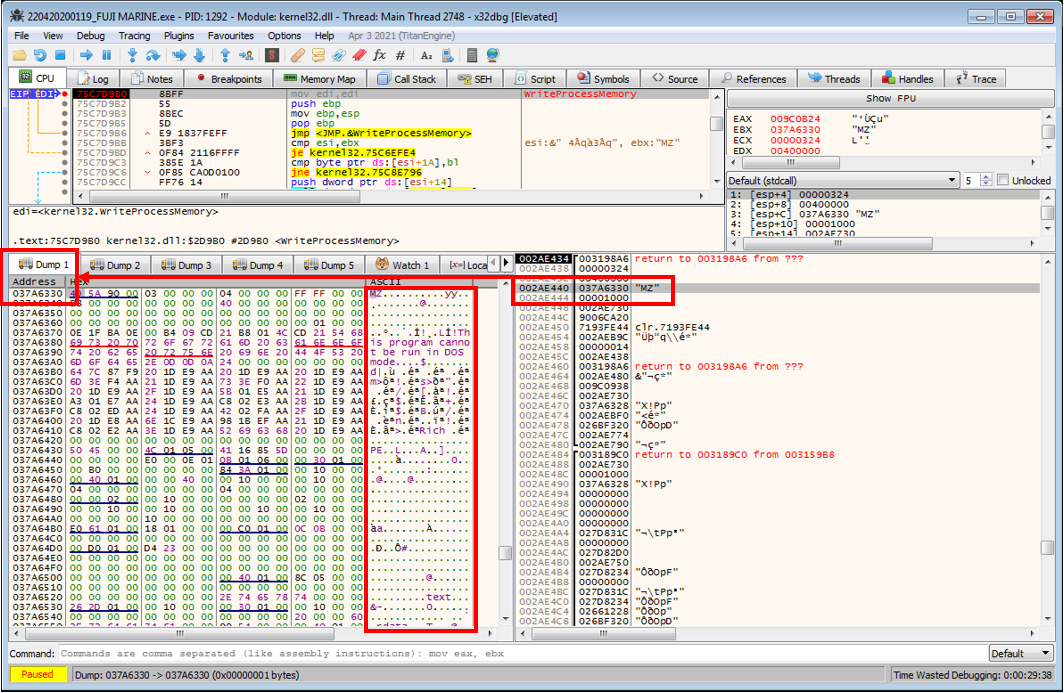
- The above image shows that the first two bytes of the data in the
lpBufferare4D 5Aindicating that this is definitely worth checking out further. By right clicking the data on the stack that islpBufferand selectingFollow DWORD in Dump, the full executable payload to be written is visible in the dump. Cursory inspection and comparison to the start of the sample currently being debugged shows that the data being written does differ - likely indicating that the final unpacked payload has been found.
-
This executable can now be dumped by highlighting all of the executable’s bytes starting at the MZ header until the point where there is only empty data in the dump, then right-clicking the highlighted data and selecting
Binary->Save To a File. -
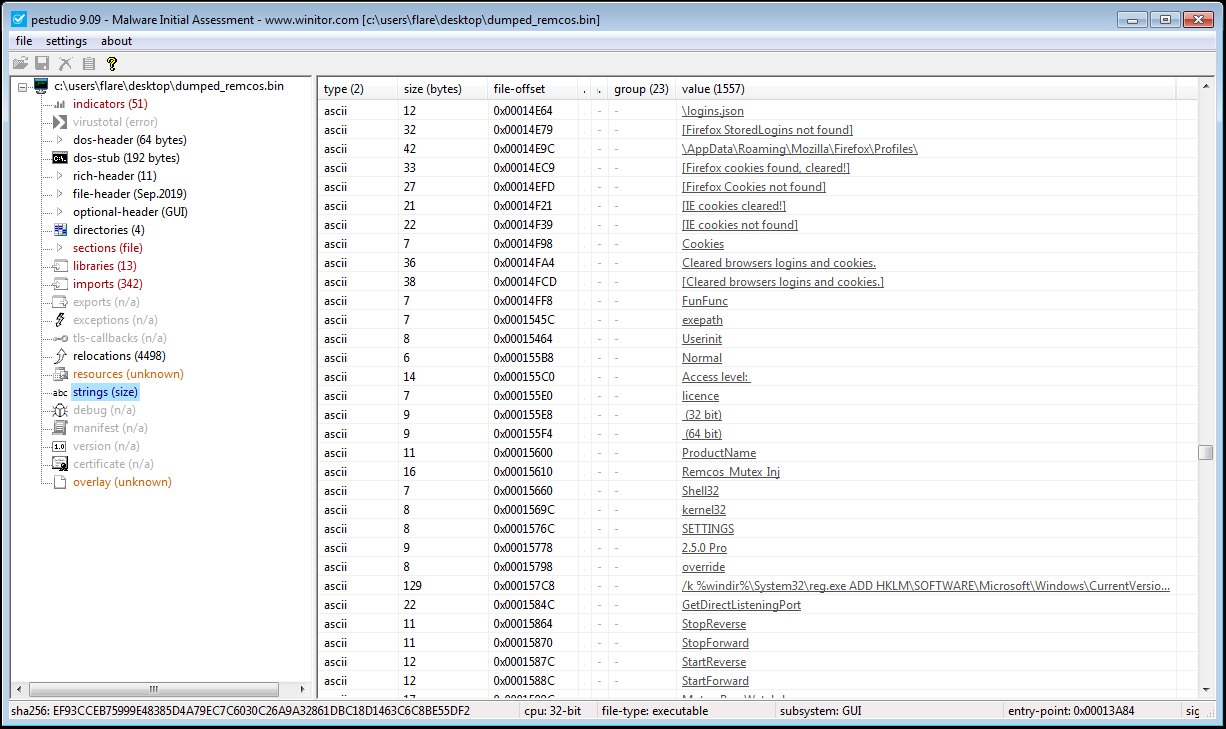
At this point, the unpacked Remcos sample should have been dumped out to a file! In this case, the executable had not been mapped, so standard tools like pestudio, CFF Explorer or PE Bear should be able to correctly parse the executable. pestudio shows that the file is a
Microsoft Visual C++ v6.032-bit executable, imports 342 functions - many of which could suggest that the executable has keylogging / stealing capabilities, and even contains aRemcos Mutexstring!
Now that the sample has been successfully unpacked, analysis can begin on the actual remcos malware - which brings us to the end of this post, so thanks for reading!
If you’d like to know more about the course or request content for this blog, feel free to email me at apr4h.ctf@gmail.com.